SUSH ALGOStep-by-Step Guide for Trading Using the Script
1. Asset Selection
When applying this script, the first thing to do is select your desired asset to trade.
You can select from the following assets within the script:
Scalping
Gold
USD/JPY
EUR/USD
EUR/JPY
BTC/USD
NIFTY 50
The parameters for the strategy (e.g., q, r, s, and ADX Threshold) will adjust automatically based on your selected asset. If you want to use custom parameters, turn on the Use Manual Settings option.
2. Adjust Manual Settings (Optional)
Use Manual Settings: Toggle this if you want to input your custom values for the strategy parameters.
Manual q: Affects swing period calculation.
Manual r: Affects the smoothing in the calculation of the oscillator.
Manual s: Affects the smoothing period of the main line of the oscillator.
Manual Signal Length: Length of the signal line for generating buy/sell signals.
Manual ADX Threshold: Adjusts the ADX value to filter trades based on trend strength.
3. Reading the SMI (Stochastic Momentum Index) Oscillator
SMI: This indicator oscillates between overbought and oversold levels, signaling potential entry and exit points.
Overbought Level: +30
Oversold Level: -30
The signal line is calculated based on the smoothed SMI value.
A crossover above the signal line in the oversold region (< -30) signals a buy.
A crossunder below the signal line in the overbought region (> +30) signals a sell.
4. Trade Signal Alerts
Buy Signal Alert: Triggered when the SMI crosses over the signal line in the oversold zone, and ADX exceeds the threshold.
Sell Signal Alert: Triggered when the SMI crosses under the signal line in the overbought zone, and ADX exceeds the threshold.
5. Entry, Stop Loss, and Target Levels
Entry Line: The script will plot an entry line at the close price when a buy or sell signal is triggered.
Stop Loss: A stop loss will be set based on the lowest low (for buy signals) or highest high (for sell signals) of the previous candles.
Take Profit Targets:
Target 1 (TP1): 3 times the size of the entry candle.
Target 2 (TP2): 6 times the size of the entry candle.
Target 3 (TP3): 10 times the size of the entry candle.
Make sure the Show Entry, Show Stop Loss, and Show Targets toggles are enabled to visualize these lines on the chart.
6. Monitoring the ADX (Average Directional Index)
The ADX value filters weak signals, ensuring that you trade only in trending markets.
If ADX > adxThreshold, the trend is strong, and the buy or sell signal becomes valid.
If ADX < adxThreshold, the trade signals are ignored to avoid trading in sideways markets.
7. Box, Line, and Label Toggles for Swing Highs/Lows
The script allows you to visualize swing highs and lows for better market context. You can toggle the following options:
Show Boxes: Displays rectangular boxes around the swing highs and lows.
Show Swing Lines: Plots lines at swing highs and lows for visual confirmation of key price levels.
Show Labels: Adds text labels to the swing levels, indicating whether they represent a swing high or low.
8. Customize Appearance (Optional)
You can change the appearance of the boxes, lines, and labels, such as their color, width, and style (solid or dotted), from the Appearance settings.
9. Monitor Volume and Open Interest (Optional)
You can also track volume and open interest (OI) data from various exchanges like Binance and BitMEX to get additional confirmations.
Steps for Trading
1.Select your asset from the drop-down menu based on your trading preferences.
2.Adjust manual settings (optional) if you want to use your own parameters for the strategy.
3.Wait for a buy or sell signal to trigger based on the crossover of the SMI oscillator in the overbought/oversold regions.
4.Once a signal is triggered, check for the plotted entry price, stop loss, and take profit levels on your chart.
5.Monitor the ADX value to ensure that the market is trending strongly.
6.If the trade meets your criteria, enter the trade at the indicated price.
Set your stop loss and take profit orders as indicated by the script.
Key Notes
# This strategy is designed for both trending and mean-reversion markets depending on the asset and the ADX value.
# Make sure to practice proper risk management by adjusting the stop loss and position size based on your risk tolerance.
Wyszukaj w skryptach "the strat"
Descriptive Backtesting Framework (DBF)As the name suggests, this is a backtesting framework made to offer full backtesting functionality to any custom indicator in a visually descriptive way.
Any trade taken will be very clear to visualize on the chart and the equity line will be updated live allowing us to use the REPLAY feature to view the strategy performing in real time.
Stops and Targets will also get draw on the chart with labels and tooltips and there will be a table on the top right corner displaying lots of descriptive metrics to measure your strategy's performance.
IF YOU DECIDE TO USE THIS FRAMEWORK, PLEASE READ **EVERYTHING** BELOW
HOW TO USE IT
Step 1 - Insert Your Strategy Indicators:
Inside this framework's code, right at the beginning, you will find a dedicated section where you can manually insert any set of indicators you desire.
Just replace the example code in there with your own strategy indicators.
Step 2 - Specify The Conditions To Take Trades:
After that, there will be another section where you need to specify your strategy's conditions to enter and exit trades.
When met, those conditions will fire the trading signals to the trading engine inside the framework.
If you don't wish to use some of the available signals, please just assign false to the signal.
DO NOT DELETE THE SIGNAL VARIABLES
Step 3 - Specify Entry/Exit Prices, Stops & Targets:
Finally you'll reach the last section where you'll be able to specify entry/exit prices as well as add stops and targets.
On most cases, it's easier and more reliable to just use the close price to enter and exit trades.
If you decide to use the open price instead, please remember to change step 2 so that trades are taken on the open price of the next candle and not the present one to avoid the look ahead bias.
Stops and targets can be set in any way you want.
Also, please don't forget to update the spread. If your broker uses commissions instead of spreads or a combination of both, you'll need to manually incorporate those costs in this step.
And that's it! That's all you have to do.
Below this section you'll now see a sign warning you about not making any changes to the code below.
From here on, the framework will take care of executing the trades and calculating the performance metrics for you and making sure all calculations are consistent.
VISUAL FEATURES:
Price candles get painted according to the current trade.
They will be blue during long trades, purple on shorts and white when no trade is on.
When the framework receives the signals to start or close a trade, it will display those signals as shapes on the upper and lower limits of the chart:
DIAMOND: represents a signal to open a trade, the trade direction is represented by the shape's color;
CROSS: means a stop loss was triggered;
FLAG: means a take profit was triggered;
CIRCLE: means an exit trade signal was fired;
Hovering the mouse over the trade labels will reveal:
Asset Quantity;
Entry/Exit Prices;
Stops & Targets;
Trade Profit;
Profit As Percentage Of Trade Volume;
**Please note that there's a limit as to how many labels can be drawn on the chart at once.**
If you which to see labels from the beginning of the chart, you'll probably need to use the replay feature.
PERFORMANCE TABLE:
The performance table displays several performance metrics to evaluate the strategy.
All the performance metrics here are calculated by the framework. It does not uses the oficial pine script strategy tester.
All metrics are calculated in real time. If using the replay feature, they will be updated up to the last played bar.
Here are the available metrics and their definition:
INITIAL EQUITY: the initial amount of money we had when the strategy started, obviously...;
CURRENT EQUITY: the amount of money we have now. If using the replay feature, it will show the current equity up to the last bar played. The number on it's right side shows how many times our equity has been multiplied from it's initial value;
TRADE COUNT: how many trades were taken;
WIN COUNT: how many of those trades were wins. The percentage at the right side is the strategy WIN RATE;
AVG GAIN PER TRADE: the average percentage gain per trade. Very small values can indicate a fragile strategy that can behave in unexpected ways under high volatility conditions;
AVG GAIN PER WIN: the average percentage gain of trades that were profitable;
AVG GAIN PER LOSS: the average percentage loss on trades that were not profitable;
EQUITY MAX DD: the maximum drawdown experienced by our equity during the entire strategy backtest;
TRADE MAX DD: the maximum drawdown experienced by our equity after one single trade;
AVG MONTHLY RETURN: the compound monthly return that our strategy was able to create during the backtested period;
AVG ANNUAL RETURN: this is the strategy's CAGR (compound annual growth rate);
ELAPSED MONTHS: number of months since the backtest started;
RISK/REWARD RATIO: shows how profitable the strategy is for the amount of risk it takes. Values above 1 are very good (and rare). This is calculated as follows: (Avg Annual Return) / mod(Equity Max DD). Where mod() is the same as math.abs();
AVAILABLE SETTINGS:
SPREAD: specify your broker's asset spread
ENABLE LONGS / SHORTS: you can keep both enable or chose to take trades in only one direction
MINIMUM BARS CLOSED: to avoid trading before indicators such as a slow moving average have had time to populate, you can manually set the number of bars to wait before allowing trades.
INITIAL EQUITY: you can specify your starting equity
EXPOSURE: is the percentage of equity you wish to risk per trade. When using stops, the strategy will automatically calculate your position size to match the exposure with the stop distance. If you are not using stops then your trade volume will be the percentage of equity specified here. 100 means you'll enter trades with all your equity and 200 means you'll use a 2x leverage.
MAX LEVERAGE ALLOWED: In some situations a short stop distance can create huge levels of leverage. If you want to limit leverage to a maximum value you can set it here.
SEVERAL PLOTTING OPTIONS: You'll be able to specify which of the framework visuals you wish to see drawn on the chart.
FRAMEWORK **LIMITATIONS**:
When stop and target are both triggered in the same candle, this framework isn't able to enter faster timeframes to check which one was triggered first, so it will take the pessimistic assumption and annul the take profit signal;
This framework doesn't support pyramiding;
This framework doesn't support both long and short positions to be active at the same time. So for example, if a short signal is received while a long trade is open, the framework will close the long trade and then open a short trade;
FINAL CONSIDERATIONS:
I've been using this framework for a good time and I find it's better to use and easier to analyze a strategy's performance then relying on the oficial pine script strategy tester. However, I CANNOT GUARANTEE IT TO BE BUG FREE.
**PLEASE PERFORM A MANUAL BACKTEST BEFORE USING ANY STRATEGY WITH REAL MONEY**

Potential Divergence Checker#### Key Features
1. Potential Divergence Signals:
Potential divergences can signal a change in price movement before it occurs. This indicator identifies potential divergences instead of waiting for full confirmation, allowing it to detect signs of divergence earlier than traditional methods. This provides more flexible entry points and can act as a broader filter for potential setups.
2. Exposing Signals for External Use:
One of its advanced features is the ability to expose signals for use in other scripts. This allows users to integrate divergence signals and related entry/exit points into custom strategies or automated systems.
3. Custom Entry/Exit Timing Based on Years and Days:
The indicator provides entry and exit signals based on years and days, which could be useful for time-specific market behavior, long-term trades, and back testing.
#### Basic Usage
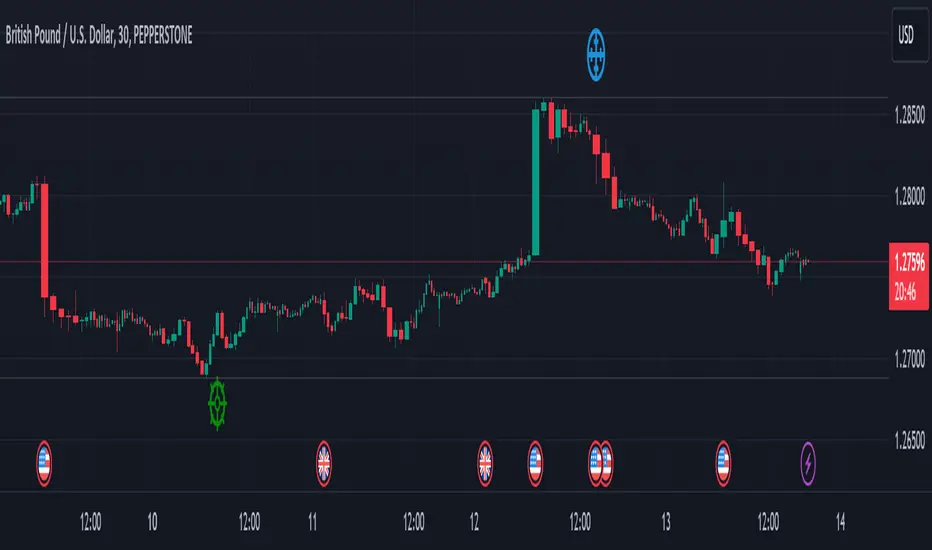
This indicator can check for all types of potential divergences: bullish, hidden bullish, bearish, hidden bearish. All you need to do is choose the type you want to check for under “DIVERGENCE TYPE” in the settings. On the chart, potential bullish divergences will show up as triangles below the price candles. one the chart potential bearish divergences will show up as upside down triangles above the price candles
#### Signals for Advanced Usage
You can use this indicator as a source in other indicators or strategies using the following information:
“ PD: Bull divergence signal ” will return “1” when a divergence is present and “0” when not present
“ PD: HBull divergence(hidden bull) signal ” will return “1” when a divergence is present and “0” when not present
“ PD: Bear divergence signal ” will return “1” when a divergence is present and “0” when not present
“ PD: HBear divergence(hidden bear) signal ” will return “1” when a divergence is present and “0” when not present
“ PD: enter ” signal will return a “1” when both the days and years criteria in the “entry filter settings” are met and “0” when not met.
“ PD: exit ” signal will return a “1” when the days criteria in the “exit filter settings” are met and “0” when not met.
#### Examples of Using Signals
1. If you are testing a long strategy for Bitcoin and do not want it to run during bear market years(e.g., the second year after a US presidential election), you can enable the “year and day filter for entry,” uncheck the following years in the settings: 2010, 2014, 2018, 2022, 2026, and reference the signal below in our strategy
signal: “ PD: enter ”
2. Let’s say you have a good long strategy, but want to make it a bit more profitable, you can tell the strategy not to run on days where there is potential bearish divergence and have it only run on more profitable days using these signals and the appropriate settings in the indicator
signal: “ PD: Bear divergence signal ” will return a ‘0’ with no bearish divergence present
signal: “ PD: enter ” will return a “1” if the entry falls on a specific, more profitable day chosen in the settings
#### Disclaimer
The "Potential Divergence Checker" indicator is a tool designed to identify potential market signals. It may have bugs and not do what it should do. It is not a guarantee of future trading performance, and users should exercise caution when making trading decisions based on its outputs. Always perform your own research and consider consulting with a financial advisor before making any investment decisions. Trading involves significant risk, and past performance is not indicative of future results.

ICT Unicorn | Flux Charts💎 GENERAL OVERVIEW
Introducing our new ICT Unicorn Indicator! This indicator is built around the ICT's "Unicorn" strategy. The strategy uses Breaker Blocks and Fair Value Gaps for entry confirmation. For more information about the process, check the "HOW DOES IT WORK" section.
Features of the new ICT Unicorn Indicator :
Implementation of ICT's Unicorn Strategy
Toggleable Retracement Entry Method
3 Different TP / SL Methods
Customizable Execution Settings
Customizable Backtesting Dashboard
Alerts for Buy, Sell, TP & SL Signals
📌 HOW DOES IT WORK ?
The ICT Unicorn entry model merges the concepts of Breaker Blocks and Fair Value Gaps (FVGs), offering a distinct method for identifying trade opportunities. By integrating these two elements, we can have a position entry with stop-loss and take-profit targets on the potential support & resistance zones. This model is particularly reliable for trade entry, as it combines two powerful entry techniques.
An ICT Unicorn Model consists of a FVG which is overlapping with a Breaker Block of the same type. Here is an example :
When a FVG overlaps with a Breaker Block of the same type, the indicator gives a Buy or Sell signal depending on the FVG type (Bullish & Bearish). If the "Require Retracement" option is enabled in the settings, the signals are not given immediately. Instead, the current price of the ticker will need to touch the FVG once more before the signals are given.
After the Buy or Sell signal, the indicator immediately draws the take-profit (TP) and stop-loss (SL) targets. The indicator has three different TP & SL modes, explained in the "Settings" section of this write-up.
You can set up alerts for entry and TP & SL signals, and also check the current performance of the indicator and adjust the settings accordingly to the current ticker using the backtesting dashboard.
🚩 UNIQUENESS
This indicator is an all-in-one suit for the ICT's Unicorn concept. It's capable of plotting the strategy, giving signals, a backtesting dashboard and alerts feature. Different and customizable algorithm modes will help the trader fine-tune the indicator for the asset they are currently trading. Three different TP / SL modes are available to suit your needs. The backtesting dashboard allows you to see how your settings perform in the current ticker. You can also set up alerts to get informed when the strategy is executable for different tickers.
⚙️ SETTINGS
1. General Configuration
FVG Detection Sensitivity -> You may select between Low, Normal, High or Extreme FVG detection sensitivity. This will essentially determine the size of the spotted FVGs, with lower sensitivies resulting in spotting bigger FVGs, and higher sensitivies resulting in spotting all sizes of FVGs.
Swing Length -> Swing length is used when finding order block formations. Smaller values will result in finding smaller order & breaker blocks.
Require Retracement ->
a) Disabled : The entry signal is given immediately once a FVG overlaps with a Breaker Block of the same type.
b) Enabled : The current price of the ticker will need to touch the FVG once more before the entry signal is given.
2. TP / SL
TP / SL Method ->
a) Unicorn : This is the default option. The SL will be set to the lowest low of the last 100 bars with an extra offset in a Buy signal. For Sell signals, the SL will be set to the highest high of the last 100 bars with an extra offset. The TP is then set to a value using the SL value and maintaining a risk-reward ratio.
b) Dynamic: The TP / SL zones will be auto-determined by the algorithm based on the Average True Range (ATR) of the current ticker.
c) Fixed : You can adjust the exact TP / SL ratios from the settings below.
Dynamic Risk -> The risk you're willing to take if "Dynamic" TP / SL Method is selected. Higher risk usually means a better winrate at the cost of losing more if the strategy fails. This setting is has a crucial effect on the performance of the indicator, as different tickers may have different volatility so the indicator may have increased performance when this setting is correctly adjusted.

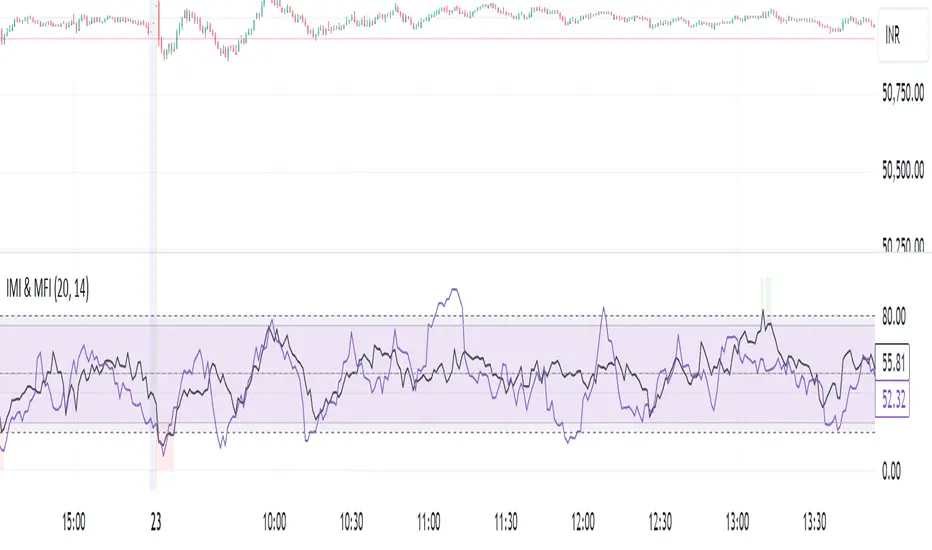
IMI and MFI CombinedFor a strategy using the combined IMI (Intraday Momentum Index), MFI (Money Flow Index), and Bollinger Bands on a 1-minute chart of Bank NIFTY (Bank Nifty Index), here's how you can interpret the indicators and define a sell signal strategy:
Strategy Explanation:
IMI (Intraday Momentum Index):
IMI measures the ratio of upward price changes to downward price changes over a specified period, indicating momentum.
In the script, IMI is plotted with a range from 0 to 100. Levels above 75 are considered overbought, and levels below 25 are oversold.
Strategy Condition: A sell signal can be considered when IMI is above 75, indicating a potentially overbought market condition.
MFI (Money Flow Index):
MFI measures the strength of money flowing in and out of a security, using price and volume.
In the script, MFI is plotted with levels at 80 (overbought) and 20 (oversold).
Strategy Condition: A sell signal can be considered when MFI is above 80, suggesting an overbought condition in the market.
Bollinger Bands:
Bollinger Bands consist of a middle band (SMA) and upper/lower bands representing volatility levels around the price.
In the script, Bollinger Bands are plotted with a length of 20 and a standard deviation multiplier of 2.
Strategy Condition: While not explicitly used for generating sell signals in this script, Bollinger Bands can help confirm price volatility and potential reversals when combined with other indicators.
Sell Signal Criteria:
IMI Sell Signal: Look for instances where IMI rises above 75. This indicates that the recent upward price momentum may be reaching an unsustainable level, potentially signaling a reversal or a pullback in prices.
MFI Sell Signal: Look for MFI rising above 80. This suggests that the market has experienced strong buying pressure, possibly leading to an overbought condition where a price correction or reversal might occur.
Implementation Considerations:
Confirmation: Consider waiting for both IMI and MFI to confirm the overbought condition simultaneously before entering a sell trade. This can increase the reliability of the signal.
Risk Management: Use stop-loss orders to manage risk in case the market moves against the anticipated direction after the sell signal is triggered.
Timeframe: This strategy is tailored for a 1-minute chart, meaning signals should be interpreted and acted upon quickly due to the rapid nature of price movements in intraday trading.
By combining these indicators and interpreting their signals, you can develop a systematic approach to identifying potential sell opportunities in the Bank NIFTY index on a 1-minute timeframe. Adjustments to indicator parameters and additional technical analysis may further refine the strategy based on your trading preferences and risk tolerance.
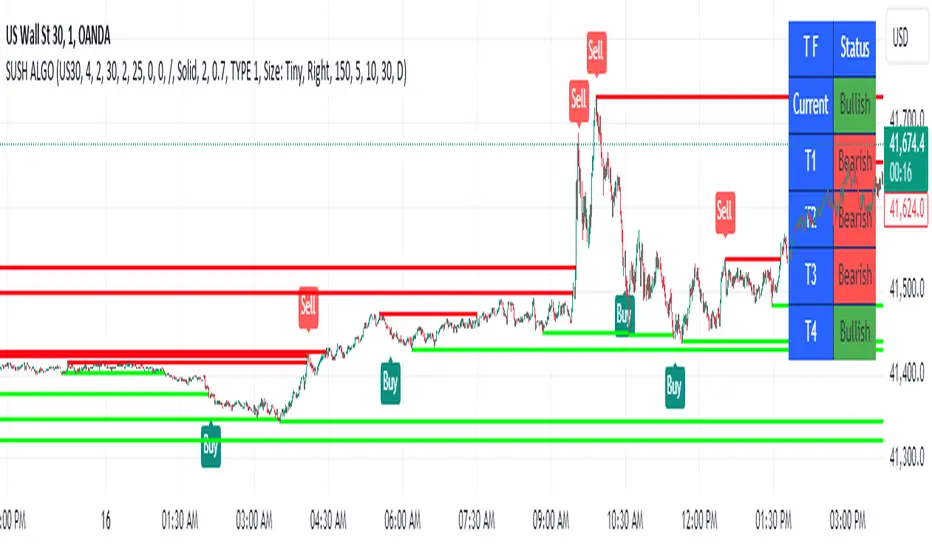
Enhanced BOS Strategy with SL/TP and EMA TableDescription:
The Enhanced BOS (Break of Structure) Strategy is an advanced open-source trading indicator designed to identify key market structure changes, integrated with dynamic Stop Loss (SL) and Take Profit (TP) levels, along with an informative EMA (Exponential Moving Average) table for added trend analysis.
Key Features:
Break of Structure (BOS) Detection:
The script detects bullish and bearish BOS by identifying pivot points using a custom pivot period. When the price crosses above or below these points, it signals a potential market trend reversal or continuation.
Dynamic SL/TP Levels:
Users can toggle static SL/TP settings, which automatically calculate levels based on user-defined points. These levels are visualized on the chart with dotted lines and labeled for clarity.
Volume Filters:
The strategy includes a volume condition filter to ensure that only trades within a specified volume range are considered. This helps in avoiding low-volume trades that might lead to false signals.
EMA Table Display:
An on-chart table displaying the current values of the 13-period, 50-period, and 200-period EMAs. This provides a quick reference for trend identification and confirmation, helping traders to stay aligned with the broader market trend.
How It Works:
The script utilizes a combination of moving averages and pivot points to identify potential breakouts or breakdowns in market structure. When a bullish BOS is detected, and the volume conditions are met, the strategy suggests a long position, marking potential SL/TP levels. Similarly, it suggests short positions for bearish BOS.
The EMA table serves as a visual aid, providing real-time updates of the EMA values, allowing traders to gauge the market’s directional bias quickly.
How to Use:
Setting Parameters:
Adjust the pivot period to fine-tune BOS detection according to your trading style and the asset’s volatility.
Configure the SL/TP settings based on your risk tolerance and target profit levels.
Interpreting Signals:
A “Buy” label on the chart indicates a bullish BOS with volume confirmation, signaling a potential long entry.
A “Sell” label indicates a bearish BOS with volume confirmation, signaling a potential short entry.
The EMA table aids in confirming these signals, where the position of the fast, mid, and slow EMAs can provide additional context to the trend’s strength and direction.
Volume Filtering:
Ensure your trades are filtered through the script’s volume condition, which allows for the exclusion of low-volume periods that might generate unreliable signals.
Unique Value:
Unlike many other BOS strategies, this script integrates volume conditions and a visual EMA table, providing a comprehensive toolkit for traders looking to capture market structure shifts while maintaining an eye on trend direction and trade execution precision.
Additional Information:
This script is designed for use on standard bar or candlestick charts for best results.
It is open-source and free to use, encouraging collaboration and improvement by the TradingView community.
By combining powerful trend-following EMAs with the precision of BOS detection and the safety of volume filtering, the Enhanced BOS Strategy offers a balanced approach to trading market structure changes.

RSI with Bollinger Bands Scalp Startegy (1min)
------------------------------------------------------------------------------
The "RSI with Bollinger Bands Scalp Strategy (1min)" is a highly effective tool designed for traders who engage in short-term scalping on the 1-minute chart. This indicator combines the strengths of the RSI (Relative Strength Index) and Bollinger Bands to generate precise buy signals, helping traders make quick and informed decisions in fast-moving markets.
How It Works:
RSI (Relative Strength Index):
The RSI is a widely-used momentum oscillator that measures the speed and change of price movements. It operates on a scale of 0 to 100 and helps identify overbought and oversold conditions in the market.
This strategy allows customization of the RSI's lower and upper bands (default settings: 30 for the lower band and 70 for the upper band) and the RSI length (default: 14).
Bollinger Bands:
Bollinger Bands consist of a central moving average (the basis) and two bands that represent standard deviations above and below the basis. These bands expand and contract based on market volatility.
In this strategy, the Bollinger Bands are used to identify potential buy and sell signals based on the price's relationship to the upper and lower bands.
Signal Generation:
Buy Signal: A buy signal is triggered when two conditions are met:
The RSI value falls below the specified lower band, indicating an oversold condition.
The price crosses below the lower Bollinger Band.
The buy signal is then issued on the first positive candle (where the closing price is greater than or equal to the opening price) after these conditions are met.
Sell Signal: In this version of the strategy, the sell signal is currently disabled to focus solely on generating and optimizing the buy signals for scalping.
Strategy Highlights:
This indicator is particularly effective for traders who focus on 1-minute charts and want to capitalize on rapid price movements.
The combination of RSI and Bollinger Bands ensures that buy signals are only generated during significant oversold conditions, helping to filter out false signals.
Customization:
Users can adjust the RSI length, Bollinger Bands length, and the standard deviation multiplier to better fit their specific trading style and the asset they are trading.
The moving average type for Bollinger Bands can be selected from various options, including SMA, EMA, SMMA, WMA, and VWMA, allowing further customization based on individual preferences.
Usage:
Use this indicator on a 1-minute chart to identify potential buy opportunities during short-term price dips.
Since the sell signals are disabled, this strategy is best used in conjunction with other indicators or strategies to manage exit points effectively.
This "RSI with Bollinger Bands Scalp Strategy (1min)" indicator is a valuable tool for traders looking to enhance their short-term trading performance by focusing on high-probability entry points in volatile market conditions.

Fibonacci Retracements & Trend Following Strategy V2This Pine Script strategy generates trading signals using Fibonacci levels and trend-following indicators.
1. Strategy Summary
This strategy analyzes price movements using a combination of Fibonacci levels and trend-following indicators, providing potential trading signals. The strategy includes Fibonacci levels as well as EMA (Exponential Moving Average) and ADX (Average Directional Index) indicators.
2. Indicators and Parameters
Fibonacci Levels
Fibonacci Level 1, Level 2, Level 3, Level 4: Used as Fibonacci retracement levels. These levels are typically set at 0.236, 0.382, 0.618, and 0.786. Users can adjust these values according to their preferences.
Trend-Following Indicator
Trend Length: The period for calculating the EMA used as the trend-following indicator. For example, if set to 20, the EMA will be calculated over 20 periods.
ADX (Average Directional Index)
ADX Length: The period for calculating the ADX. ADX measures the strength of the price trend and is usually set to 14 periods.
ADX Threshold: A threshold value for the ADX. This value determines when trading signals will be activated.
3. Usage Steps
Displaying the Indicator on the Chart:
On the TradingView platform, paste the code into the Pine Editor and click the "Add to Chart" button to add it to the chart.
Analyzing the Indicators:
Fibonacci Levels: Show retracement levels of price movements. When the price reaches one of these levels, potential reversals may occur.
Trend-Following Indicator: EMAs determine the direction of the trend. Green EMA represents an uptrend, while red EMA represents a downtrend.
ADX: Measures the strength of the trend. When ADX surpasses the threshold value, it indicates a strong trend.
Trading Signals:
Long Signal: Generated when the price is above the second Fibonacci level and the trend is upward. Additionally, the ADX value must be above the set threshold.
Short Signal: Generated when the price is below the second Fibonacci level and the trend is downward. Additionally, the ADX value must be above the set threshold.
Target Prices:
Long Targets: Determines upward targets based on Fibonacci levels. These targets indicate expected prices if the price reverses from Fibonacci levels.
Short Targets: Determines downward targets based on Fibonacci levels. These targets indicate expected prices if the price reverses from Fibonacci levels.
4. Chart Displays
Trend Up (Green Line): Shows the rising EMA.
Trend Down (Red Line): Shows the falling EMA.
Fibonacci Levels (Blue Lines): Shows Fibonacci retracement levels.
Long Targets (Green Circles): Shows targets for long positions.
Short Targets (Red Circles): Shows targets for short positions.
Long Signal (Green Label): Buy signal.
Short Signal (Red Label): Sell signal.
5. Important Notes
Retracement and Target Levels: Fibonacci levels can act as potential retracement or support/resistance levels. However, they should always be used in conjunction with other technical analysis tools.
Trend and ADX: ADX is used to determine the strength of the trend. Be aware that when ADX is low, trends may be weak.
6. Example Scenarios
Example 1: If the trend is upward (green EMA) and the price is above the second Fibonacci level, you may receive a long position signal. If the ADX value is above the threshold, the signal may be stronger.
Example 2: If the trend is downward (red EMA) and the price is below the second Fibonacci level, you may receive a short position signal. If the ADX value is above the threshold, the signal may be stronger.
This updated version contains significant improvements in both technical aspects and user experience. Innovations such as ADX calculations and dynamic Fibonacci levels make the strategy more robust and flexible. The code's readability and comprehensibility have been enhanced, and errors have been corrected.
This guide will help you understand the basic operation of the strategy. It is always recommended to conduct your own research and test the strategy before using it.
GOOD LUCK. // halilvarol

Artaking 2Components of the Indicator:
Moving Averages:
Short-Term Moving Average (MA): This is a 50-period Simple Moving Average (SMA) applied to the closing price. It is used to track the short-term trend of the market.
Long-Term Moving Average (MA): This is a 200-period SMA used to track the long-term trend.
Day Trading Moving Average: A 20-period SMA is used specifically for day trading signals, focusing on shorter-term price movements.
Purpose:
The crossing of these moving averages (short-term crossing above or below long-term) provides basic buy and sell signals, indicative of potential trend reversals or continuations.
ADX (Average Directional Index) for Trend Strength:
ADX Calculation: The ADX is calculated using a 14-period length with 14-period smoothing. The ADX value indicates the strength of a trend, regardless of direction.
Strong Trend Condition: The indicator considers a trend to be strong if the ADX value is above 25. This threshold helps filter out trades during weak or sideways markets.
Purpose:
To ensure that the strategy only generates signals when there is a strong trend, thus avoiding whipsaws in low volatility or range-bound conditions.
Support Levels:
Support Level Calculation: The indicator calculates the lowest close over the last 100 periods. This level is used to identify significant support zones where the price might find a floor.
Purpose:
Support levels are critical in identifying potential areas where the price might bounce, making them ideal for setting stop losses or identifying buy opportunities.
Volatility Spike (Proxy for News Trading):
ATR (Average True Range) Calculation: The indicator uses a 14-period ATR to measure market volatility. A volatility spike is identified when the ATR is greater than 1.5 times the 14-period SMA of the ATR.
Purpose:
This serves as a proxy for news events or other sudden market movements that could make the market unpredictable. The indicator avoids generating signals during these periods to reduce the risk of being caught in a volatile, potentially news-driven move.
Fibonacci Retracement Levels:
61.8% Fibonacci Level: Calculated from the highest high and lowest low over the long MA period, this retracement level is widely regarded as a significant support or resistance level.
Purpose:
Position traders often use Fibonacci levels to identify potential reversal points. The indicator incorporates the 61.8% level to fine-tune entries and exits.
Candlestick Patterns for Price Action Trading:
Bullish Engulfing Pattern: A bullish reversal pattern where a green candle fully engulfs the previous red candle.
Bearish Engulfing Pattern: A bearish reversal pattern where a red candle fully engulfs the previous green candle.
Purpose:
These patterns are classic signals used in price action trading to identify potential reversals at key levels, especially when they align with other conditions like support/resistance or Fibonacci levels.
Signal Generation:
The indicator generates buy and sell signals by combining the above elements:
Buy Signal:
A buy signal is triggered when:
The short-term MA crosses above the long-term MA (indicating a potential uptrend).
The trend is strong (ADX > 25).
The current price is near or below the 61.8% Fibonacci retracement level, suggesting a potential reversal.
No significant volatility spike is detected, ensuring the market isn’t reacting unpredictably to news.
Sell Signal:
A sell signal is triggered when:
The short-term MA crosses below the long-term MA (indicating a potential downtrend).
The trend is strong (ADX > 25).
The current price is near or above the 61.8% Fibonacci retracement level, suggesting potential resistance.
No significant volatility spike is detected.
Day Trading Signals:
Independent of the main trend signals, the indicator also generates intraday buy and sell signals when the price crosses above or below the 20-period day trading MA.
Price Action Signals:
The indicator can trigger buy or sell signals based purely on price action, such as the occurrence of bullish or bearish engulfing patterns. This is optional and can be enabled or disabled.
Alerts:
The indicator includes built-in alert conditions that notify the trader when a buy or sell signal is generated. This allows traders to act immediately without having to constantly monitor the charts.
Practical Application:
This indicator is versatile and can be used across various trading styles:
Position Trading: The long-term MA, Fibonacci retracement, and ADX provide a solid foundation for identifying long-term trends and potential entry/exit points.
Day Trading: The short-term MA and day trading MA offer quick signals for intraday trading.
Price Action: Candlestick pattern recognition allows for precise entry points based on market sentiment and behavior.
News Trading: The volatility spike filter helps avoid trading during periods of market instability, often driven by news events.
Conclusion:
The Comprehensive Trading Strategy Indicator is a robust tool designed to help traders navigate various market conditions by integrating multiple strategies into a single, coherent framework. It provides clear, actionable signals while filtering out potentially dangerous trades during volatile or weak market conditions. Whether you're a long-term trader, a day trader, or someone who relies on price action, this indicator can be a valuable addition to your trading toolkit.

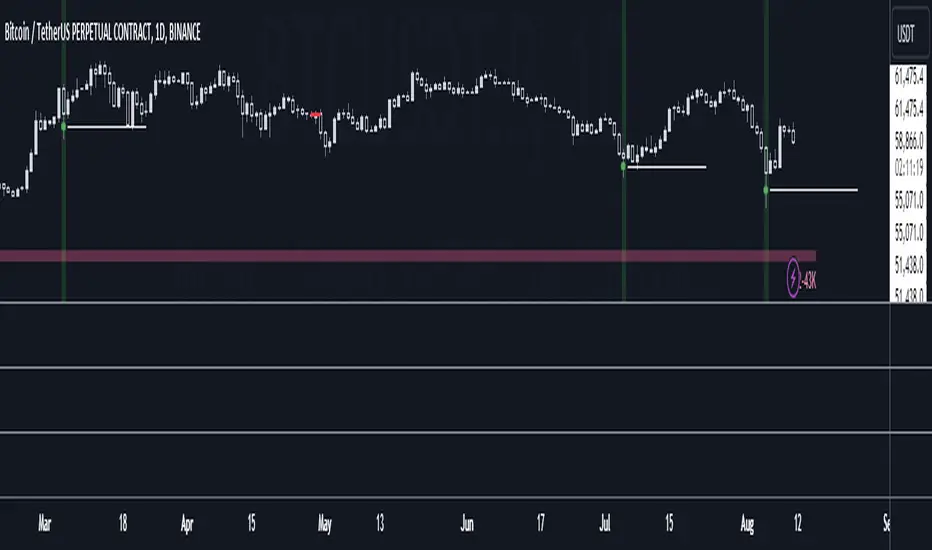
LibyanSatoshi Wick FillThis is an indicator for wick fill strategy, It is an approach that focuses on the movement of price back into the 50% of a previous candle's wick. Here's an overview of this strategy:
The strategy is based on the idea that price often retraces to fill gaps or wicks left by strong moves in the market.
It particularly looks at candles with long wicks, which represent areas where price moved significantly but then reversed.
Long Wick Candles : These are candles where the wick (upper or lower shadow) is significantly longer than the body.
Trading Approach:
Entry: Traders enter a position when price starts moving back into the wick of a previous candle.
Stop Loss: Often placed beyond the end of the wick being filled.
Take Profit: Can be set at the opposite end of the candle whose wick is being filled, or at other significant levels.
Confluence:
Most effective when combined with other technical analysis tools or when the wick coincides with significant support/resistance levels.
Risks:
Not all wicks get filled, and price can reverse before reaching the full extent of the wick.
False signals can occur in choppy or ranging markets.
Benefits:
Provides clear entry and exit points.
Can be an effective way to enter trends or identify potential reversals.
Considerations:
Market sentiment is crucial; wick fills may have different implications in trending vs. ranging markets.
The size of the wick and the time frame it appears on can affect the reliability of the signal.
While the wick fill strategy can be a useful tool in a trader's arsenal, it's important to use it in conjunction with other forms of analysis and proper risk management. As with any trading strategy, it's not foolproof and requires practice and discretion to use effectively.
TrendScope:TrendScope Indicator Description with First-Time User Tutorial
---
Overview:
The TrendScope indicator is designed to give traders a comprehensive view of the market by combining multiple filter sets that analyze different aspects of price action. The filter sets allow you to switch between different views effortlessly and avoid indicator clutter. Whether you're scalping, swing trading, or identifying breakout opportunities, TrendScope helps you make informed decisions by assessing momentum, volatility, trade timing, and trend direction. It also includes a scalp setup you can use to execute trades and manage risk.
---
TrendScope Filter Sets with First-Time User Setup & Tutorial
---
Filter Set A: Short-Term Momentum
Goal:
This filter focuses on the immediate market sentiment without any additional indicators. It reveals where retail traders might enter the market, potentially highlighting areas where they could be stopped out. The goal is to identify these weak spots and anticipate likely price movements that could follow.
No Additional Indicators Required:
This filter set uses moving averages (SMA 20, SMA 50, SMA 100) to determine the short-term trend.
Tutorial:
- To Confirm an Uptrend: Ensure all moving averages are aligned in sequence: SMA 20 above SMA 50, and SMA 50 above SMA 100, all trending upwards.
Action: Consider going long using the scalper in Filter Set D.
- To Confirm a Downtrend: Ensure all moving averages are aligned in sequence: SMA 20 below SMA 50, and SMA 50 below SMA 100, all trending downwards.
Action: Consider going short using the scalper in Filter Set D.
- To Confirm Consolidation: If the moving averages are not aligned or are intertwined, the market is either about to or already trending sideways. The market is in a consolidation phase.
Action: Switch to Filter Set C for further analysis.
---
Filter Set B: Long-Term Momentum
Goal:
Similar to the short-term filter, but with a broader perspective. It helps in understanding the bigger picture, providing insights into longer-term trends and potential reversals for swing trade entries.
No Additional Indicators Required:
This filter set uses moving averages (SMA 20, SMA 100, SMA 200) to determine the long-term trend.
Tutorial:
- To Confirm an Uptrend: Ensure all moving averages are aligned in sequence: SMA 20 above SMA 100, and SMA 100 above SMA 200, all trending upwards.
Action: Consider going long using the scalper in Filter Set D.
- To Confirm a Downtrend: Ensure all moving averages are aligned in sequence: SMA 20 below SMA 100, and SMA 100 below SMA 200, all trending downwards.
Action: Consider going short using the scalper in Filter Set D.
- To Confirm Consolidation: If the moving averages are not aligned or are intertwined, the market is either about to or already trending sideways. The market is in a consolidation phase.
Action: Switch to Filter Set C for further analysis.
---
Filter Set C: Trading Range
This filter uses Bollinger Bands, Volume, and Volume-Weighted Relative Volume Profile (VRVP) to identify trading ranges and predict breakouts and trade timing. In short, when Bollinger Bands contract and volume is below average, the VRVP highlights low-volume areas that can serve as breakout targets, offering a timing edge.
Goal:
Anticipate breakouts in a sideways market.
Additional Indicators Required:
- VRVP: For visualizing volume at specific price levels.
- Volume Indicator: With a 100-period moving average for anticipating low market participation.
Tutorial:
1. Setup Screen: Zoom out to see the entire consolidation phase.
2. Identify Support & Resistance:
- Use VRVP to determine VAH (upper range) and VAL (lower range) support or resistance levels.
- Identify the POC (Point of Control) as the area with the highest support or resistance.
3. Wait for Setup:
- Wait for Bollinger Bands to contract and volume to dip below the average.
- Go short if the price is at VAH, go long if the price is at VAL.
4. Action: Switch to Filter Set D for precise entry, target, and risk management.
---
Filter Set D: Scalper
After determining the market condition using the previous filter sets, you can use this filter set to hunt for trades. Designed for use with Heikin Ashi candles, this filter allows you to enter when there’s high momentum and provides a trailing stop along the way.
Goal:
Execute trades in harmony with the established trend.
Setup Rules:
1. Condition 1: You know the current trend direction as per filter set guidance (A, B, & C), and the trend is up, and you are going long.
2. Condition 2: Wait for the price to close 3 consecutive flat-bottom Heikin Ashi candles above the 7 MA. Then Enter on the open of the fourth Candle.
3. Condition 3: The 3x candles have to be above the 7 MA (red line), and the 7 MA has to be above the 50 EMA (yellow line).
Trade Management:
Use the 50 EMA (Yellow Line) as a trailing stop and hold the position until a candle opens and closes below the 7 SMA (Red Line).
---
Additional Filter Sets
These filter sets are designed to accommodate various trading strategies, allowing for flexibility depending on the trader's approach.
---
Filter Set E: VWAP
When using the VWAP filter, load the On-Balance Volume (OBV) indicator to complement your analysis. This combination can help confirm volume trends and potential price movements.
Tips:
Look for instances where the VWAP aligns with OBV divergences to confirm or negate potential trade setups.
Tutorial:
- Complement with OBV: Look for volume confirmations.
- Usage: Switch the candles to a line chart. Wait for both the line to close above the VWAP and OBV above the Smoothing Line. Then, switch to Filter Set D and hunt for a long entry as per the strategy. Do the opposite for hunting short entries.
---
Filter Set F: Super Trend
This filter is most effective when paired with the Ichimoku Cloud (using custom settings) along with the MACD and ADX indicators.
Goal:
Gauge trend strength, momentum, and support and resistance levels.
Tutorial:
- Load Ichimoku, MACD, and ADX: To gauge trend strength and momentum.
- Usage Tips:
I use the cloud to look for long periods where the clouds print horizontal levels and use them for support and resistance levels. Alternatively, use the ADX. When the price breaks up through the super trend downtrend line and retraces back to the top of the Ichimoku cloud, switch to Filter Set D and hunt for a long scalp entry. For a short entry, wait for the price to break through the Up Trend Line and retrace back up to the cloud. Then, switch to Filter Set D and use the setup to hunt for a short.
---
Filter Set G: Keltner Channels
Combine this filter with Donchian Channels and the Average True Range (ATR) for enhanced volatility analysis. This filter set works similarly to Filter Set C.
Goal:
Measure volatility and predict breakouts.
Tutorial:
- Load Donchian Channels or ATR: To measure volatility and breakouts.
- Usage Tips:
Look for the price to fall through the Keltner lower line and the ATR making a higher low. Then, use the scalper for entries, with Donchian boundaries as take-profit estimates.
---
Filter Set H: Pivot Points
This filter works with the RSI to spot divergences that could signal a trend change or reversal.
Goal:
Identify divergences and trend reversals.
Tutorial:
- Load RSI: For identifying divergences.
- Usage Tips:
Use RSI in conjunction with pivot points to identify divergences. Then, switch to Filter Set D and use the scalper to hunt for swing entries in the divergence direction.
---
Filter Set I: Opening Range Breakout
This filter uses the Seasonality indicator to gauge investor sentiment and prediction sentiment.
Goal:
Assess market sentiment and predict breakout directions.
Tutorial:
- Load Seasonality Indicator: To assess market sentiment.
- Usage Tips:
Use seasonal trends to gauge potential breakout directions. Use on the daily timeframe only. Risk on investment zones are when the price is close to the ORB low level. Realize investment profit when the price is nearing the ORB high level, considering that there has to be divergence as determined using Filter Set H.
---
By following this structured approach, traders can learn to navigate different market conditions, using TrendScope to make informed decisions based on a comprehensive analysis of momentum, trend, and volatility. The goal is to go through all the filter sets and combine them with the scalp setup in Filter Set D, using the additional filters to adapt to various strategies and market conditions.

The Flip by Tren10xWhat the Script Does:
"The Flip" is a simple trading script designed to enhance market analysis and trading decisions by detecting key price levels and timeframe shifts. It identifies when timeframes switch from bullish to bearish or vice versa and displays this information using the 50% levels and the Full Time Frame Continuity (FTFC) table.
How the Script Works:
Detection of Key Levels:
50% Level of the Previous Candle: The script calculates and displays the midpoint of the previous candle, helping traders quickly identify potential reversal points and key support or resistance levels.
Opening Print Levels: The script tracks the opening prices for various timeframes (Day, Week, Month, Quarter, and Year), indicating whether the current price is above or below these levels to understand market sentiment and trends.
High/Low Levels: It monitors and displays the Previous Day High/Low, Week High/Low, Month High/Low, Quarter High/Low, and Year High/Low, highlighting significant price levels and potential breakout or breakdown points.
Full Time Frame Continuity Table:
The script provides a visual table showing the alignment of different timeframes (bullish or bearish), allowing traders to make informed decisions based on the overall market structure.
How to Use the Script:
Add to Chart:
Load "The Flip" script onto your TradingView chart.
Customize Settings:
Adjust the appearance and display settings to fit your trading preferences.
Analyze the Chart:
Use the 50% level of the previous candle to identify potential reversal points.
Track the opening print levels for various timeframes to gauge market sentiment.
Monitor the high/low levels to spot significant price levels and potential breakout or breakdown points.
Refer to the FTFC table to see the alignment of different timeframes and make decisions based on the overall market structure.
What Makes This Script Original:
Integration with "The Strat"
Inspired by "The Strat" created by Rob Smith, "The Flip" focuses on the critical moment when timeframes switch from bullish to bearish or vice versa, providing a unique perspective on market movements.
Comprehensive Market View:
By displaying the 50% level of the previous candle, opening print levels, high/low levels, and a full time frame continuity table, the script offers a holistic view of the market, helping traders make more informed decisions.
User-Friendly Visualization:
The script's visual indicators and FTFC table make it easy to quickly assess market conditions and potential trading opportunities, enhancing both the efficiency and effectiveness of market analysis.
When Full Time-Frame Continuity is bullish, you will see a green check mark ✔️, indicating all major timeframes (Daily, Weekly, Month, Quarter, and Year) are aligned.
When Full Time-Frame Continuity is bearish, you will see a red drop 🩸, indicating all major timeframes (Daily, Weekly, Month, Quarter, and Year) are aligned.
Otherwise, you will see mixed timeframes.

ICT Power Of Three | Flux Charts💎 GENERAL OVERVIEW
Introducing our new ICT Power Of Three Indicator! This indicator is built around the ICT's "Power Of Three" strategy. This strategy makes use of these 3 key smart money concepts : Accumulation, Manipulation and Distribution. Each step is explained in detail within this write-up. For more information about the process, check the "HOW DOES IT WORK" section.
Features of the new ICT Power Of Three Indicator :
Implementation of ICT's Power Of Three Strategy
Different Algorithm Modes
Customizable Execution Settings
Customizable Backtesting Dashboard
Alerts for Buy, Sell, TP & SL Signals
📌 HOW DOES IT WORK ?
The "Power Of Three" comes from these three keywords "Accumulation, Manipulation and Distribution". Here is a brief explanation of each keyword :
Accumulation -> Accumulation phase is when the smart money accumulate their positions in a fixed range. This phase indicates price stability, generally meaning that the price constantly switches between up & down trend between a low and a high pivot point. When the indicator detects an accumulation zone, the Power Of Three strategy begins.
Manipulation -> When the smart money needs to increase their position sizes, they need retail traders' positions for liquidity. So, they manipulate the market into the opposite direction of their intended direction. This will result in retail traders opening positions the way that the smart money intended them to do, creating liquidity. After this step, the real move that the smart money intended begins.
Distribution -> This is when the real intention of the smart money comes into action. With the new liquidity thanks to the manipulation phase, the smart money add their positions towards the opposite direction of the retail mindset. The purpose of this indicator is to detect the accumulation and manipulation phases, and help the trader move towards the same direction as the smart money for their trades.
Detection Methods Of The Indicator :
Accumulation -> The indicator detects accumulation zones as explained step-by-step :
1. Draw two lines from the lowest point and the highest point of the latest X bars.
2. If the (high line - low line) is lower than Average True Range (ATR) * accumulationConstant
3. After the condition is validated, an accumulation zone is detected. The accumulation zone will be invalidated and manipulation phase will begin when the range is broken.
Manipulation -> If the accumulation range is broken, check if the current bar closes / wicks above the (high line + ATR * manipulationConstant) or below the (low line - ATR * manipulationConstant). If the condition is met, the indicator detects a manipulation zone.
Distribution -> The purpose of this indicator is to try to foresee the distribution zone, so instead of a detection, after the manipulation zone is detected the indicator automatically create a "shadow" distribution zone towards the opposite direction of the freshly detected manipulation zone. This shadow distribution zone comes with a take-profit and stop-loss layout, customizable by the trader in the settings.
The X bars, accumulationConstant and manipulationConstant are subject to change with the "Algorithm Mode" setting. Read the "Settings" section for more information.
This indicator follows these steps and inform you step by step by plotting them in your chart.
🚩UNIQUENESS
This indicator is an all-in-one suite for the ICT's Power Of Three concept. It's capable of plotting the strategy, giving signals, a backtesting dashboard and alerts feature. Different and customizable algorithm modes will help the trader fine-tune the indicator for the asset they are currently trading. The backtesting dashboard allows you to see how your settings perform in the current ticker. You can also set up alerts to get informed when the strategy is executable for different tickers.
⚙️SETTINGS
1. General Configuration
Algorithm Mode -> The indicator offers 3 different detection algorithm modes according to your needs. Here is the explanation of each mode.
a) Small Manipulation
This mode has the default bar length for the accumulation detection, but a lower manipulation constant, meaning that slighter imbalances in the price action can be detected as manipulation. This setting can be useful on tickers that have lower liquidity, thus can be manipulated easier.
b) Big Manipulation
This mode has the default bar length for the accumulation detection, but a higher manipulation constant, meaning that heavier imbalances on the price action are required in order to detect manipulation zones. This setting can be useful on tickers that have higher liquidity, thus can be manipulated harder.
c) Short Accumulation
This mode has a ~70% lower bar length requirement for accumulation zone detection, and the default manipulation constant. This setting can be useful on tickers that are highly volatile and do not enter accumulation phases too often.
Breakout Method -> If "Close" is selected, bar close price will be taken into calculation when Accumulation & Manipulation zone invalidation. If "Wick" is selected, a wick will be enough to validate the corresponding zone.
2. TP / SL
TP / SL Method -> If "Fixed" is selected, you can adjust the TP / SL ratios from the settings below. If "Dynamic" is selected, the TP / SL zones will be auto-determined by the algorithm.
Risk -> The risk you're willing to take if "Dynamic" TP / SL Method is selected. Higher risk usually means a better winrate at the cost of losing more if the strategy fails. This setting is has a crucial effect on the performance of the indicator, as different tickers may have different volatility so the indicator may have increased performance when this setting is correctly adjusted.
3. Visuals
Show Zones -> Enables / Disables rendering of Accumulation (yellow) and Manipulation (red) zones.

GG Short & Long IndicatorGG Short & Long Indicator is a powerful signal indicator with AI
How do indicator signals work?
The main purpose of the indicator is to give a signal that is most likely to bring profit based on historical data. This ORIGINAL trend algorithm gives SHORT and LONG signals when several conditions coincide: 1) Breakout of the average value of the modernized VWAP (this VWAP takes data only from certain time periods and trading sessions, as a result, its breakout most often coincides with the beginning of a strong trend); 2) The previous condition must be confirmed by volumes. I noticed that on some crypto exchanges, depending on whether the breakout is false or true, the volumes are different relative to each other. I applied this knowledge for additional filtering of signals (this point works only on crypto assets, on other assets the algorithm works without taking it into account, maybe later I will refine it); 3) When some of my original formulas to determine overbought (similar in principle to RSI, but more designed to work with the trader algorithm), should not show overbought - so that the entry into the transaction was not at too unfavorable values. To summarize, the algorithm tries to find a balance to determine a true breakout, during which the price will not go too far (for an acceptable RR).
But the most important thing is that the parameters to customize the algorithm are governed by our original AI algorithm. It can adjust the indicator in two modes: 1) Settings are selected based on the most profitable historical settings. 2) The settings are selected based not only on historical profitability, but also on winrate, frequency of trades, and a few other items that we will not disclose (so the code is closed) - we consider this approach as a priority, because according to our observations, it gives the highest performance compared to manual tuning. In addition, AI simply simplifies the work with the indicator - you do not need to adjust the settings manually for different trading pairs or timeframes, AI will do it all by itself and immediately give the ready result (backtest) on the table.
How to trade?
After the signal is issued, the indicator determines the recommended levels to close the trade (green dots). Stop loss should be placed behind the corresponding gray SL mark. Levels for closing a deal (TP) and the level of stop loss setting (SL) are also determined automatically for the selected pair and TF, based on volatility and selected indicator settings
To make a trade, you can also use the built-in “Support and Resistance Zones” tool, which displays ranges on the chart based on the modernized ATR, from which the price is more likely to rebound (here I also used my own approach, where in addition to the classic ATR formula, I also used volumes from certain crypto exchanges to determine more accurate price rebound zones)
These zones are also adjusted by AI - the algorithm compares several dozens of variations of these zones (with different settings) and chooses the one that best fits the current settings of the signal algorithm. For example, if the indicator is set up for frequent trades - the zones will be updated faster and will be less deep than if the indicator is set up for medium-term trading
If desired, you can customize the indicator manually using the corresponding section of the settings. Each paramater has a tooltip describing how and what it affects.
Statistisc panel
The panel can be divided into 2 conditional parts:
1) Statistics for each individual TP for the selected strategy. It shows the winrate and gross profit, if you fix a trade on a single target completely
2) Total trading result, if you trade clearly according to the strategy and fix the position by equal hours on 4 TPs. The total trading result is displayed for the current indicator settings, it also shows the best, worst and optimal of the possible indicator settings and the trading result of these settings on the side.
How do setup the indicator?
The indicator has preset settings for several major pairs and timeframes. These are fixed settings specifically selected for individual pairs and timeframes. You can use these presets, or you can choose one of the adaptive settings, which will AUTOMATICALLY select the best/optimal indicator settings.
I recommend choosing the “Adaptive Optimal” preset, as it uses more data to determine the optimal indicator settings and according to my observations this method works better in comparison to manual indicator settings or the “Adaptive Best” preset
Or you can use the manual settings, as mentioned earlier.

Fractalyst Moving Average [Adaptive] | FractalystWhat's the indicator purpose and functionality?
Moving averages are widely used technical indicators in trading.
Typically, they provide reliable entry signals in trending markets but can falter during consolidation periods.
Now, imagine a moving average that adjusts to market conditions.
The Fractalyst Moving Average does just that by adapting to the market's noise level, which is the erratic price movement within trends or consolidation phases.
This indicator incorporates market structure into moving averages to more effectively identify potential market trends.
By dynamically calculating moving averages based on external swing highs and lows, it offers robust trend identification and adapts to different market conditions, giving traders valuable insights into current market condition.
------
How does FRMA react in a trending and consolidating market?
When the market trends, the FRMA adjusts quickly to price movements, closely tracking the trend and positioning itself close to prices. This responsiveness allows it to provide timely signals and effectively capture trends.
However, in consolidating markets where there is little net change in price over time, the FRMA reacts slowly. As consolidation prolongs, the FRMA may even cease to move significantly, appearing non-reactive. This characteristic helps minimize false signals and unnecessary trades during periods of market indecision.
Notice how the FRMA tracks prices closely when the market is trending. When the market begins to consolidate, however, the FRMA becomes relatively unresponsive and stays horizontal.
------
What are the underlying calculations behind FRMA?
Identifying Swing Highs and Lows: FRMA begins by identifying the most recent external swing highs and lows, which are key pivot points in the market's price structure.
Defining Market Structure: It calculates the distance between these external swing levels. When price remains confined between these levels, indicating a horizontal market, it signifies minor intermediate ranges or a lack of clear trend direction.
Adapting to Breaks of Structure: When a new break of structure occurs—such as a significant price movement above a previous swing high or below a swing low—the FRMA updates dynamically.
It adjusts its values to reflect the midpoint (50%) of the distance between the external swing highs and lows.
This adjustment helps the FRMA react promptly to changes in different market environments.
------
How to use the FRMA in trading?
In a trend-following context, the FRMA provides clear signals for trading:
Buying Signal: Look to buy when the FRMA is rising. This indicates that the market is in an uptrend, with prices consistently moving higher. Buying at these points aligns with the trend momentum and increases the likelihood of capturing profitable movements.
Selling Signal: Consider selling when the FRMA is falling. A declining FRMA suggests that the market is in a downtrend, where prices are consistently decreasing. Selling during these periods helps capitalize on downward movements and potential profit-taking opportunities.
Avoiding Trades: Avoid trading when the FRMA appears horizontal and the market is consolidating. This indicates a lack of clear trend direction or significant price movement, which can lead to choppy price action and increased risk of false signals. Waiting for the FRMA to resume a clear trend direction can help avoid unnecessary losses in consolidating markets.
Note: These rules are just examples and may generate numerous false signals. Even when the FRMA is less responsive, it can exhibit frequent changes in direction.
Traders should apply additional filters or confirmatory indicators to refine their trading decisions and mitigate the impact of false signals.
Depending on whether they're employing mean-reversion or trend-following trading styles, traders need to adjust other market filters accordingly.
It's crucial to conduct thorough backtesting using various market conditions and filters to validate and optimize their trading strategies effectively.
This process helps traders identify the settings that best align with their trading goals and market conditions.
------
What makes this moving average unique compared to others?
Yes, it's another moving average, but the Fractalyst Adaptive Moving Average stands out for a compelling reason.
Its calculation is more sophisticated, leveraging market structure to identify potential consolidation and trending environments, similar to conventional moving averages such as SMA and EMA.
------
How does the FRMA's stack up against the other moving averages?
Since markets are always evolving, using adaptive strategy elements like the FRMA certainly makes a whole lot of sense.
However, from a practical standpoint, the only way to find out would be to exhaustively backtest the various moving averages across all markets of interest.
Establishing equivalency between the FRMA and other moving averages may be a little challenging, since the FRMA does not use a single integer value for its lookback period.
Assuming the backtests produced roughly equal results, I’d personally prefer to use the FRMA. Its adaptive qualities give me confidence that the strategy can weather changing market conditions.
------
User-inputs and customizations
------
Terms and Conditions | Disclaimer
Our charting tools are provided for informational and educational purposes only and should not be construed as financial, investment, or trading advice. They are not intended to forecast market movements or offer specific recommendations. Users should understand that past performance does not guarantee future results and should not base financial decisions solely on historical data.
Built-in components, features, and functionalities of our charting tools are the intellectual property of @Fractalyst Unauthorized use, reproduction, or distribution of these proprietary elements is prohibited.
By continuing to use our charting tools, the user acknowledges and accepts the Terms and Conditions outlined in this legal disclaimer and agrees to respect our intellectual property rights and comply with all applicable laws and regulations.

High & Low Of Custom Session - Breakout True Open [cognyto]This indicator is based on the High & Low Of Custom Session - OpeningRange Breakout (Expo) created by Zeiierman.
It adds new functionality and enhances existing settings, targeting ES, NQ, and YM:
Manages session defaults to 12:00 to 13:00
New true opening fully customizable (default 13:00)
Manages timeframe visualization (default 15m and below)
Manages session draw length until the end of the current session (default NY)
Manages previous sessions, allowing the to be hidden
Improves timezone selection (default NY)
Following the strategy called Paradox detailed by DayTradingRauf, it works with indices like ES, NQ, and YM.
The rules consider three possible profiles:
First
AM session as consolidation (08:00-12:00)
Lunch hour range as consolidation (less than 100 points)
PM session breaking either side of the session range
Second
AM session trending lower (08:00-12:00)
Lunch hour range as consolidation (less than 100 points)
PM session trending higher
Third
AM session trending higher (08:00-12:00)
Lunch hour range as consolidation (less than 100 points)
PM session trending lower
After the session ends, the opening price at 13:00 is automatically drawn as it is a key point for the entry strategy.
The strategy can be monitored using a 5-minute or 15-minute timeframe as follows:
- Wait for a liquidity hunt (either the high or low of the lunch session range or AM is taken).
- If liquidity is taken, switch to the 1-minute timeframe and wait for a CISD (change in the state of delivery), where the price closes below an OB, or consider a breaker block or iFVG to enter the trade.
- Bullish entries should happen below the opening price at 13:00, and bearish entries should happen above.
- Consider a 1:2 reward ratio. However, runners can target the opposite side of the range that was not yet taken.
This indicator is for informational purposes only and you should not rely on any information it provides as legal, tax, investment, financial or other advice. Nothing provided by this indicator constitutes a solicitation, recommendation, endorsement or offer by cognyto or any third party service provider to buy or sell any securities or other financial instruments in this or any other jurisdiction in which such solicitation or offer would be unlawful under the securities laws of such jurisdiction.

Smoothed Heiken Ashi Candles with Delayed SignalsThis is a trend-following approach that uses a modified version of Heiken Ashi candles with additional smoothing. Here are the key components and features:
1. Heiken Ashi Modification: The strategy starts by calculating Heiken Ashi candles, which are known for better trend visualization. However, it modifies the traditional Heiken Ashi by using Exponential Moving Averages (EMAs) of the open, high, low, and close prices.
2. Double Smoothing: The strategy applies two layers of smoothing. First, it uses EMAs to calculate the Heiken Ashi values. Then, it applies another EMA to the Heiken Ashi open and close prices. This double smoothing aims to reduce noise and provide clearer trend signals.
3. Long-Only Approach: As the name suggests, this strategy only takes long positions. It doesn't short the market during downtrends but instead exits existing long positions when the sell signal is triggered.
4. Entry and Exit Conditions:
- Entry (Buy): When the smoothed Heiken Ashi candle color changes from red to green (indicating a potential start of an uptrend).
- Exit (Sell): When the smoothed Heiken Ashi candle color changes from green to red (indicating a potential end of an uptrend).
5. Position Sizing: The strategy uses a percentage of equity for position sizing, defaulting to 100% of available equity per trade. This should be tailored to each persons unique approach. Responsible trading would use less than 5% for each trade. The starting capital used is a responsible and conservative $1000, reflecting the average trader.
This strategy aims to provide a smooth, trend-following approach that may be particularly useful in markets with clear, sustained trends. However, it may lag in choppy or ranging markets due to its heavy smoothing. As with any strategy, it's important to thoroughly back test and forward test before using it with real capital, and to consider using it in conjunction with other analysis tools and risk management techniques.
Other smoothed Heiken Ashi indicators do not provide buy and sell signals, and only show the change in color to dictate a change in trend. By adding buy and sell signals after the close of the changing candle, alerts can be programmed, which helps this be a more hands off protocol to experiment with. Other smoothed Heiken Ashi indicators do not allow for alarms to be set.
This is a unique HODL strategy which helps identify a change in trend, without the noise of day to day volatility. By switching to a line chart, it removes the candles altogether to avoid even more noise. The goal is to HODL a coin while the color is bullish in an uptrend, but once the indicator gives a sell signal, to sell the holdings back to a stable coin and let the chart ride down. Once the chart gives the next buy signal, use that same capital to buy back into the asset. In essence this removes potential losses, and helps buy back in cheaper, gaining more quantitity fo the asset, and therefore reducing your average initial buy in price.
Most HODL strategies ride the price up, miss selling at the top, then riding the price back down in anticipation that it will go back up to sell. This strategy will not hit the absolute tops, but it will greatly reduce potential losses.

BCA Candlestick Pattern Condition BuilderThe "Candlestick Pattern Condition Builder" is an indicator developed for traders who want to create and customize their own trading strategies based on candlestick patterns. It allows users to set specific conditions for entering and exiting trades, both long and short. By enabling traders to define up to five conditions based on various price points (Open, High, Low and Close) and logical operators, it provides a flexible framework for building complex trading strategies tailored to individual preferences and market behavior.
Now traders can easily configure their favorite candlestick patterns like Doji, three white soldiers, three black crows or any other pattern using this indicator.
Here are the settings to customize the indicator:
Intraday Setting:
The indicator supports time-based trading by allowing users to define specific intraday sessions. Traders can set the start and end times for trading activities, ensuring that the strategy only executes trades within the defined market hours. This feature is particularly useful for intraday traders who want to avoid overnight positions and focus on capturing intraday price movements. Users can toggle the time-based entry and exit settings on or off, providing additional flexibility in managing their trading sessions.
Long and Short Candle Configuration:
"Condition Builder" enables users to configure conditions for both long and short trades using historical candle data. Traders can select different price points (open, high, low, close) from the past five bars to create their conditions. Each condition can be set with logical operators such as greater than, less than, greater than or equal to, less than or equal to, and equal to. This allows for detailed and precise condition-building, enabling traders to tailor their strategies to specific market patterns and behaviors. Note that between any two candlestick conditions "AND" operator is used.
Candle number representation as follows:
0 - N candle (current candle)
1 - N-1 candle (previous candle)
2 - N-2 candle
3 - N-3 candle
4 - N-4 candle
Stoploss and Target Options:
The indicator allows users to set stop-loss and target levels based on various criteria. Traders can choose to set these levels as a percentage, a fixed number of points, or based on the highest or lowest prices of selected candles. Additionally, the indicator supports risk
targets, providing a method to calculate targets in relation to the stop-loss distance. These features help traders manage their risk effectively and ensure that their strategies have well-defined exit points.
Stoploss Options:
1. Percentage Stoploss:
This option allows traders to set a stop-loss level as a percentage of the entry price. For example, if the stop-loss is set at 2%, the trade will close if the price moves 2% against the entry price. This dynamic approach adjusts the stop-loss level based on the trade's entry price, providing flexibility and proportional risk management.
2. Points Stoploss:
With this option, traders specify a fixed number of points for the stop-loss. For instance, if the stop-loss is set to 50 points, the trade will close if the price moves 50 points against the entry price. This fixed approach is straightforward and easy to implement, offering a clear and consistent risk threshold.
3. Highest/Lowest of Selected Candles:
This stop-loss method uses the highest or lowest prices of selected historical candles to determine the stop-loss level. Traders can select specific past bars, and the stop-loss will be set at the highest high (for short trades) or the lowest low (for long trades) of those bars. This method is useful for incorporating recent price action into risk management.
Target Options:
1. Percentage Target:
Similar to the percentage stop-loss, this option sets the target level as a percentage of the entry price. If the target is set at 5%, the trade will aim to close when the price moves 5% in favor of the entry price. This approach ensures that the target is proportionally related to the entry price, aligning with the trader’s desired profit margin.
2. Points Target :
This target option allows traders to set a specific number of points as the target. For example, if the target is set to 100 points, the trade will aim to close when the price moves 100 points in favor of the entry price. This method provides a clear and fixed profit goal, making it easy to implement and understand.
3. Risk:Reward :
The Risk:Reward sets the target level based on a multiple of the stop-loss distance. For example, with a risk ratio of 1:2 and a stop-loss distance of 50 points, the target will be set at 100 points (2 times the stop-loss distance). This approach helps traders maintain a consistent risk profile, aiming for higher profits relative to the risk taken on each trade.
Best practice: Use it with other price action concepts or indicators to make it effective.

Ultimate UT Bot ScreenerWhat Does the Ultimate UT Bot Screener Do?
Ultimate UT Bot Screener will help you navigate UT Bot signals and backtest results for up to 40 instruments simultaneously. It scans the market for provided UT Bot indicator parameters, calculates essential metrics, and displays the information in 1 fully customizable table.
How Does It Work?
Market Scanning : The screener scans multiple instruments for the selected timeframe, ensuring you never miss an opportunity.
Customizable Parameters : Adjust the UT Bot parameters to fit your unique trading style and risk tolerance.
Filtering and Sorting : Use advanced filtering and sorting options to narrow down the results based on your specific criteria.
Alerts and Notifications : Set up custom alerts to stay updated on important market movements and potential trades.
Visual Customization : Tailor the screener's visual appearance to suit your preferences, making data interpretation effortless.
Currently, Ultimate UT Bot Screener Supports 13 columns:
Price - the last price of the instrument
UT Signal - last UT bot signal. Value in the square brackets ( for ex.) means how many bars ago the last signal fired.
Move To Revert —We have to observe the price move for the current bar to see the UT Bot signal change.
Revert Prob - probability estimation for UT Bot to revert for the current bar.
Trade History - the last five trade outcomes are coded as green(profit)/red(loss) squares.
Total Trades - total trades number for UT Bot strategy for the entire available history.
Current P&L - P&L for the open trade
Trade Avg P&L - Average P&L for the last X trades
Trade Prof - percent profitable trades from the last X trades
Profit Factor - profit factor the last X trades
Net Profit - total net Profit for the last X trades
Max DD - maximum drawdown for the last X trades Avg Bars in Trades - average trade duration for the last X trades
How to Use the Ultimate UT Bot Screener
Using the Ultimate UT Bot Screener is straightforward:
Set Up Your Screener : Choose the instruments you want to monitor and configure the columns to display the data most relevant to you.
Customize Parameters : Fine-tune the UT Bot parameters to align with your trading strategy. Filter and Sort: Apply filters to isolate the most promising trading opportunities and sort the results based on your priorities.
Monitor and Act: Keep an eye on the screener and act on the high-probability signals it generates. Set up alerts to ensure you never miss a critical trade.
Why Is the Ultimate UT Bot Screener Original and Worth Paying For?
Highly Customizable : our tool allows you to configure almost every element, from the set of columns and instruments to the UT Bot parameters and visual appearance.
User-Friendly Interface : Designed with traders in mind, the screener offers an intuitive interface that makes complex data easy to understand and act upon.
Time-Saving : By automating the market scanning and analysis process, it saves you valuable time and effort, allowing you to focus on executing your trades.
Real-Time Alerts : Stay ahead of the market with customizable alerts that notify you of important events and potential trades.
Disclaimer : Please remember that past performance may not be indicative of future results. Due to various factors, including changing market conditions, the strategy may no longer perform as well as in historical backtesting. This post and the script don't provide any financial advice.

Auto Anchored Volume ProfileAuto Anchored Volume profile indicator to identify potential support and resistance zones, along with weak and strong Point of Control (POC) levels.
Understanding the Concepts:
Volume Profile: This chart depicts trading activity at various price levels over a chosen timeframe. Higher volume areas represent price levels where most buying and selling happened.
Point of Control (POC): The price level with the highest volume traded within the timeframe. It represents the price where most agreement existed between buyers and sellers.
High Volume Nodes (HVN): Areas on the volume profile with significantly higher volume compared to surrounding areas. These can indicate potential support or resistance.
Delta (Sentimental): This volume profile type shows the difference between buying and selling volume at each price level. Positive delta indicates buying dominance, while negative delta suggests selling pressure.
Strategy Breakdown:
Identify Volume Shelves:
Look for areas with concentrated volume on the profile. These areas, called shelves, can act as support (high volume at lower prices) or resistance (high volume at higher prices).
Analyze POC Strength (POC Volume Percentage):
Calculate the Volume Percentage: (Volume at Price Level / Maximum HVN Volume over the Period) * 100
This ratio indicates the significance of the POC relative to the strongest volume area.
A high percentage suggests a strong POC, potentially indicating a more reliable support or resistance level.
A low percentage suggests a weak POC, with a higher chance of price breaking through that level.
Leverage Previous Session Data:
The strategy incorporates data from the previous session's POC and Highest Delta Node. These are displayed on the right side of the chart, extending the volume profile for reference.
Identify if the current price is trading above or below the previous session's POC. This can provide context for potential price direction.
The Highest Delta Node from the previous session indicates areas of strong buying or selling sentiment that might carry over to the current session.
Additional Anchor Point Types:
Pivot Points and Fixed Range Volume Profile can be added for further confirmation of support and resistance zones.
Pivot points are calculated automatically based on the price changes direction
Fixed Range Volume Profile focuses on a specific price range, allowing detailed analysis within that zone.
Timeframe Considerations(AUTO):
The resolution for calculating pivot points is determined automatically:
- For intraday resolutions up to and including 15 minutes, the daily (1D) timeframe is used.
- For intraday resolutions more than 15 minutes, the weekly (1W) timeframe is used.
- For daily resolutions, the monthly (1M) timeframe is used.
- For weekly and monthly resolutions, the 12-month (12M) timeframe is used.
Trading with the Strategy:
Look for price approaching a volume shelf identified on the profile.
Analyze the POC Volume Percentage to gauge the strength of the POC as potential support or resistance.
Consider the previous session's POC and Highest Delta Node for additional context.
Combine volume profile insights with other technical indicators and price action confirmation for entry and exit signals.
Remember, strong POCs with high volume shelves suggest more reliable support/resistance, while weak POCs indicate a higher chance of price movement beyond that level.
Important Notes:
Volume profile is a tool to identify potential trading zones, not a guaranteed predictor of future price movements.
Always practice proper risk management techniques, including stop-loss orders.
Backtest this strategy on historical data to understand its effectiveness before risking real capital.
By understanding volume distribution and POC strength, this strategy can help you make informed trading decisions based on where most buying and selling activity has occurred. Remember, a comprehensive trading approach that considers multiple factors is crucial for success.

Sector Rotation Hedging With Volatility Index [TradeDots]The "Sector Rotation Hedging Strategy With Volatility Index" is a comprehensive trading indicator developed to optimally leverage the S&P500 volatility index. It is designed to switch between distinct ETF sectors, strategically hedging to moderate risk exposure during harsh market volatility.
HOW DOES IT WORK
The core of this indicator is grounded on the S&P500 volatility index (VIX) close price and its 60-day moving average. This serves to determine whether the prevailing market volatility is above or below the quarterly average.
In periods of elevated market volatility, risk exposure escalates significantly. Traders retaining stocks in sectors with disproportionately high volatility face increased vulnerability to negative returns. To tackle this, our indicator employs a two-pronged approach utilizing two sequential candlestick close prices to confirm if volatility surpasses the average value.
Upon confirming above-average volatility, a hedging table is deployed to spotlight ETFs with low volatility, such as the Utilities Select Sector SPDR Fund (XLU), to derisk the overall portfolio.
Conversely, in low-volatility conditions, sectors yielding higher returns like the Technology Select Sector SPDR Fund (XLK) are preferred. The hedging table is utilized to earmark high-return sector ETFs.
Thus, during highly volatile market periods, the strategy recommends enhancing portfolio allocation to low-volatility ETFs. During low-volatility windows, the portfolio is calibrated towards high-volatility ETFs for heightened returns.
IMPORTANT CONSIDERATION
In real trading, additional considerations encompassing trading commissions, management fees, and ancillary rotation costs should be factored in. False signals may arise, potentially leading to losses from these fees.
RISK DISCLAIMER
Trading entails substantial risk, and most day traders incur losses. All content, tools, scripts, articles, and education provided by TradeDots serve purely informational and educational purposes. Past performances are not definitive predictors of future results.

ICT Silver Bullet | Flux Charts💎 GENERAL OVERVIEW
Introducing our new ICT Silver Bullet Indicator! This indicator is built around the ICT's "Silver Bullet" strategy. The strategy has 5 steps for execution and works best in 1-5 min timeframes. For more information about the process, check the "HOW DOES IT WORK" section.
Features of the new ICT Silver Bullet Indicator :
Implementation of ICT's Silver Bullet Strategy
Customizable Execution Settings
2 NY Sessions & London Session
Customizable Backtesting Dashboard
Alerts for Buy, Sell, TP & SL Signals
📌 HOW DOES IT WORK ?
ICT's Silver Bullet strategy has 5 steps :
1. Mark your market sessions open (This indicator has 3 -> NY 10-11, NY 14-15, LDN 03-04)
2. Mark the swing liquidity points
3. Wait for market to take down one liquidity side
4. Look for a market structure-shift for reversals
5. Wait for a FVG for execution
This indicator follows these steps and inform you step by step by plotting them in your chart. You can switch execution types between FVG and MSS.
🚩UNIQUENESS
This indicator is an all-in-one suit for the ICT's Silver Bullet concept. It's capable of plotting the strategy, giving signals, a backtesting dashboard and alerts feature. It's designed for simplyfing a rather complex strategy, helping you to execute it with clean signals. The backtesting dashboard allows you to see how your settings perform in the current ticker. You can also set up alerts to get informed when the strategy is executable for different tickers.
⚙️SETTINGS
1. General Configuration
Execution Type -> FVG execution type will require a FVG to take an entry, while the MSS setting will take an entry as soon as it detects a market structure-shift.
MSS Swing Length -> The swing length when finding liquidity zones for market structure-shift detection.
Breakout Method -> If "Wick" is selected, a bar wick will be enough to confirm a market structure-shift. If "Close" is selected, the bar must close above / below the liquidity zone to confirm a market structure-shift.
FVG Detection -> "Same Type" means that all 3 bars that formed the FVG should be the same type. (Bullish / Bearish). "All" means that bar types may vary between bullish / bearish.
FVG Detection Sensitivity -> You can turn this setting on and off. If it's off, any 3 consecutive bullish / bearish bars will be calculated as FVGs. If it's on, the size of FVGs will be filtered by the selected sensitivity. Lower settings mean less but larger FVGs.
2. TP / SL
TP / SL Method -> If "Fixed" is selected, you can adjust the TP / SL ratios from the settings below. If "Dynamic" is selected, the TP / SL zones will be auto-determined by the algorithm.
Risk -> The risk you're willing to take if "Dynamic" TP / SL Method is selected. Higher risk usually means a better winrate at the cost of losing more if the strategy fails.
Close Position @ Session End -> If this setting is enabled, the current position (if any) will be closed at the beginning of a new session, regardless if it hit the TP / SL zone. If it's off, the position will be open until it hits a TP / SL zone.

Swing Sniper by Republic of TradersSwing Sniper: A Comprehensive Market Reversal Indicator
Description:
Swing Sniper, developed by Republic of Traders, is a sophisticated trading indicator designed for traders who require precise market reversal signals. It performs optimally across all trading instruments and timeframes, offering both reliability and precision.
How It Works:
Swing Sniper employs a complex signal generation mechanism that activates only when six distinct conditions align within a specific timeframe. This includes:
A modified Commodity Channel Index (CCI) that helps identify short-term price fluctuations.
A Relative Momentum Index (RMI) utilized for recognizing long-term market trends.
A Supertrend indicator serves as a dynamic trend filter.
Several custom parameters that enhance signal reliability.
These components work synergistically to ensure that each trading signal is robust and well-founded. The indicator specializes in capturing significant market reversals by requiring a confirmation of trend reversal through a break and close above or below a previous supply/demand zone.
Usage Instructions:
Upon a valid signal, Swing Sniper advises traders that a potential market reversal has occurred and an entry may be considered in the direction of the new trend. Traders are recommended to set alerts for "once per candle close," allowing them to monitor multiple charts and timeframes simultaneously. Proper risk management is encouraged by placing stop losses just below or above the previous swing low or high and the signal candle's low or high. Take profits should similarly be set to capitalize on potential swings.
Why Choose Swing Sniper:
Swing Sniper is designed not only as a tool for generating entries but as a strategic component of your trading methodology. It brings a clear, analytical approach to navigating the markets, supported by detailed and logical indicator collaboration. This ensures users understand the underlying mechanics and can apply the tool effectively within their trading strategy.
Commitment to Originality and Utility:
Swing Sniper is a unique creation, adhering to TradingView’s standards by offering actionable insights that are distinct from other indicators available on the platform. It is meticulously crafted, featuring an original combination of technical analysis tools tailored to enhance market reversal detection.
Disclaimer:
Past performance is not indicative of future results. Always exercise due diligence and consider market conditions when trading.
Visualization Aid:
The accompanying chart visualization helps users identify signal examples, marked with a red triangle for market reversals short and a green triangle for market reversals long.
Embrace the strategic depth and precision of Swing Sniper and enhance your trading confidence and accuracy in financial markets.